Audience Engagement Heatmap
See Exactly Where Your Audience Engages Most
Audience engagement heatmap tool


See Audience Engagement Heatmap In Action
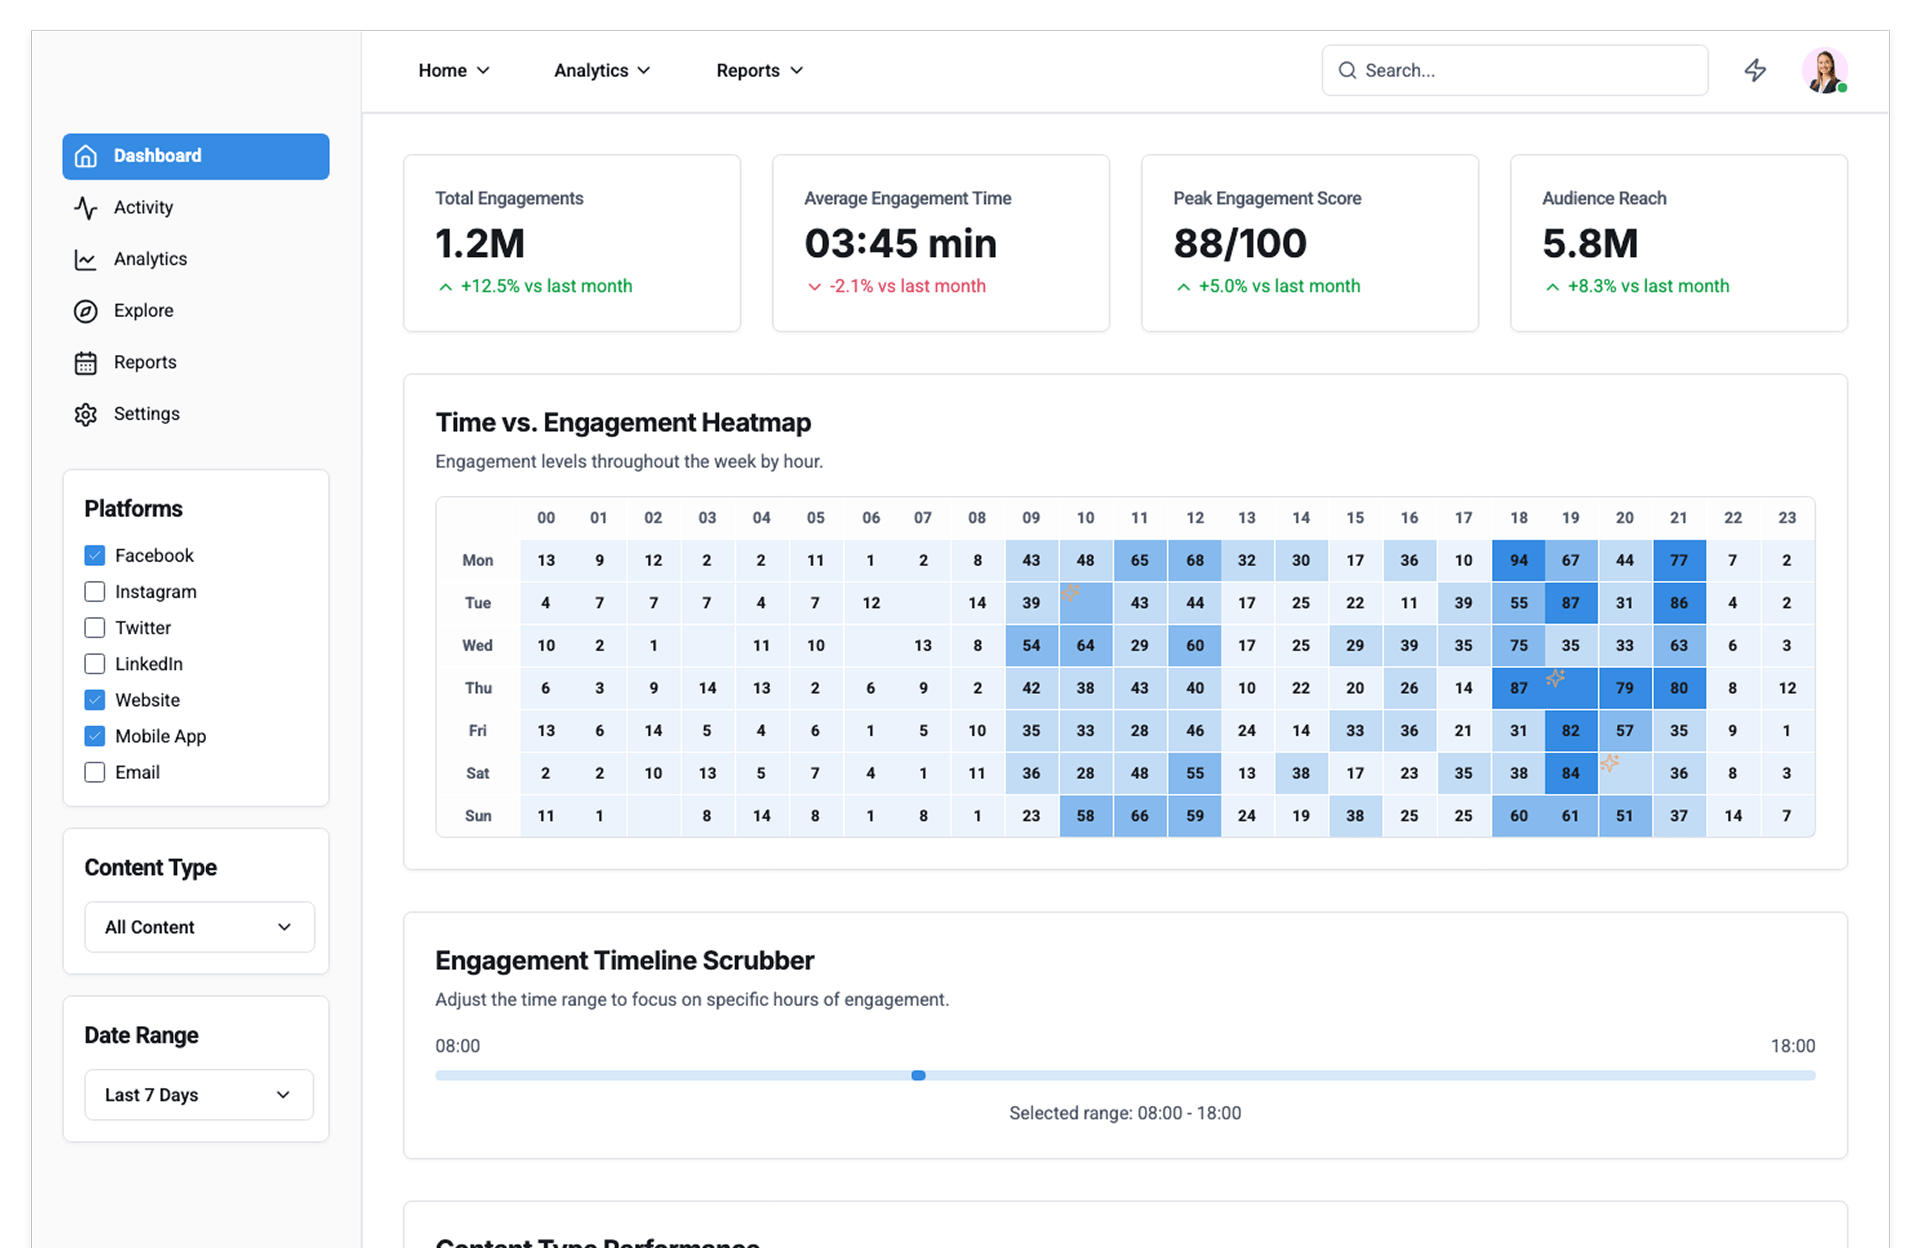
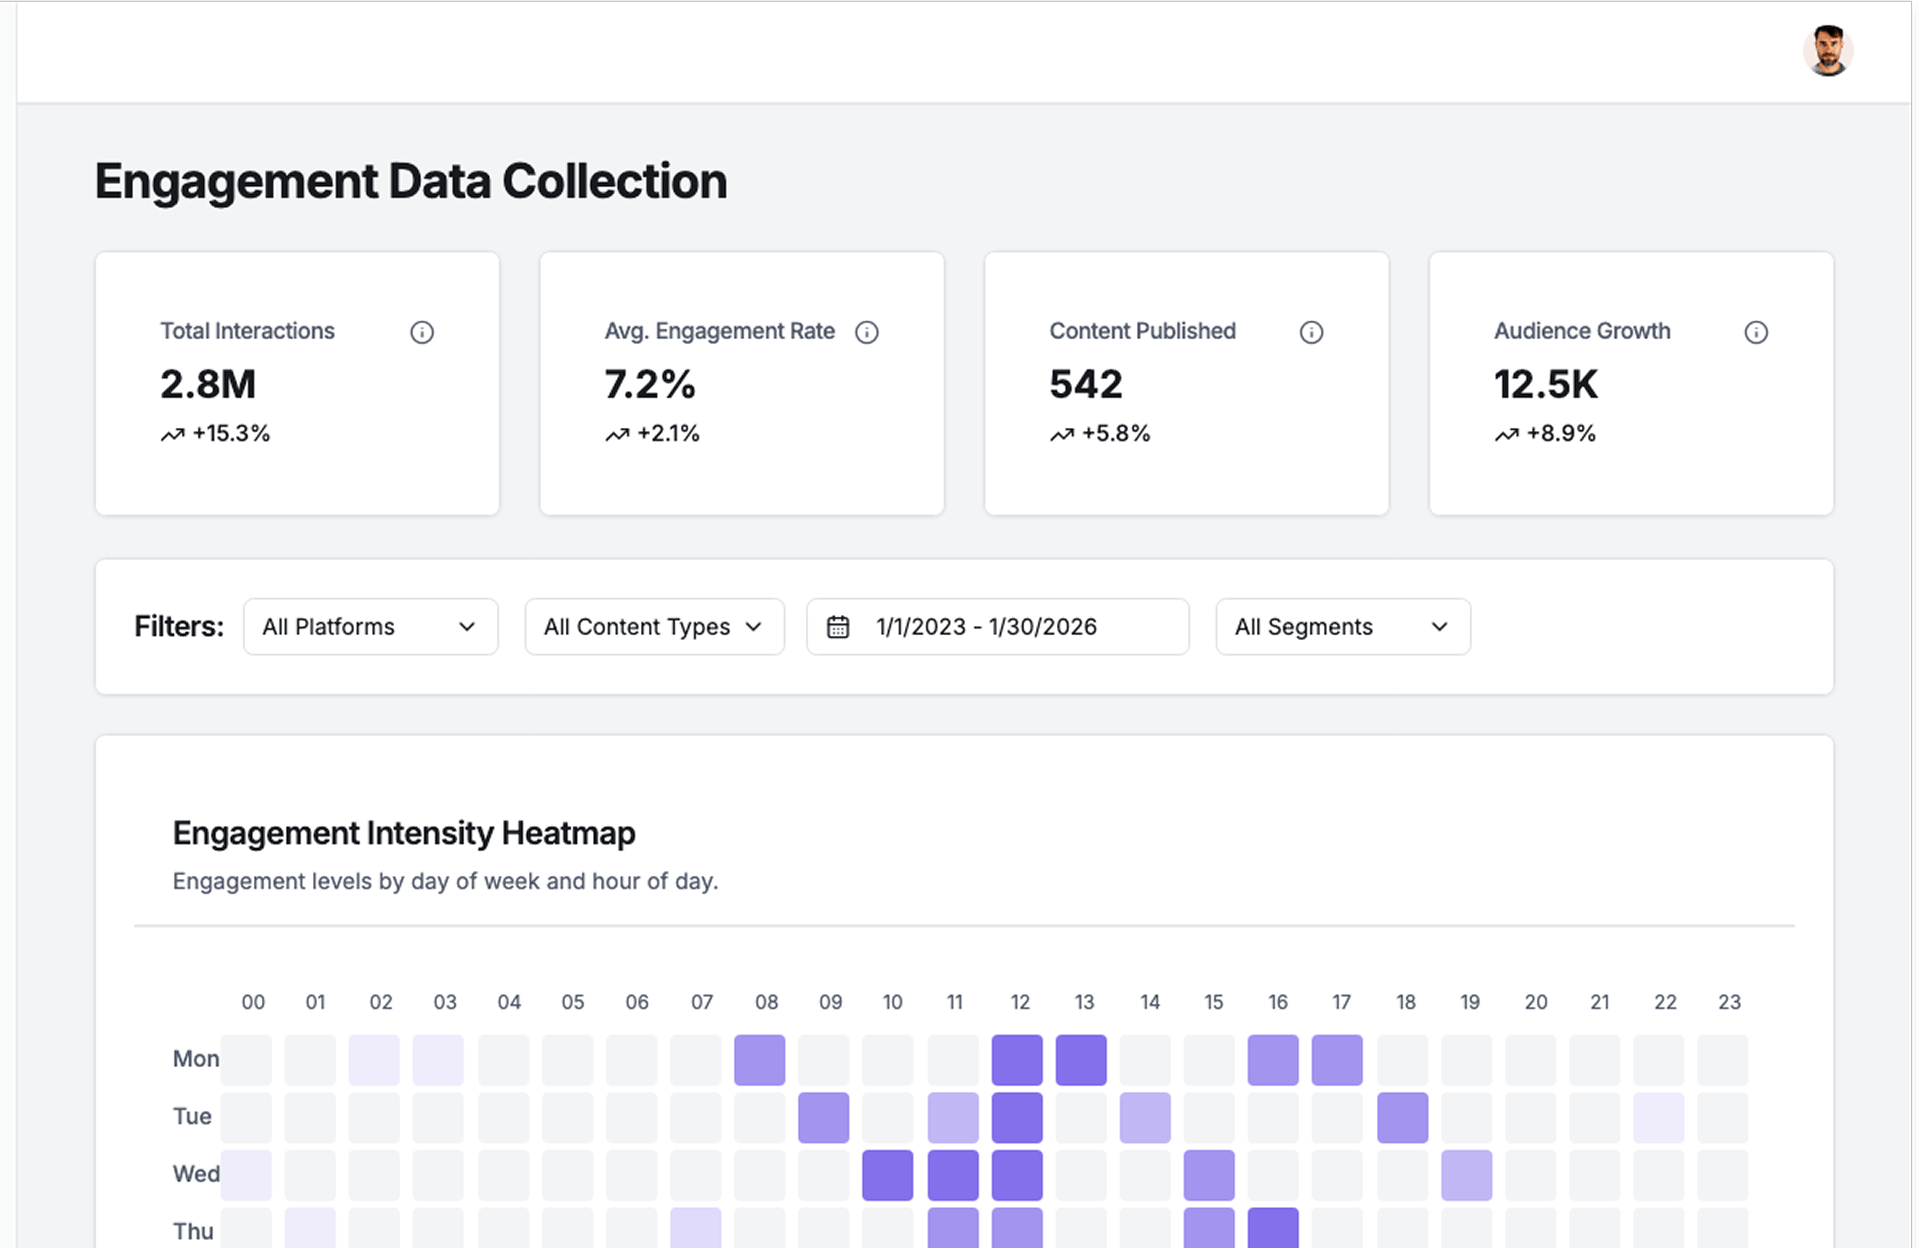
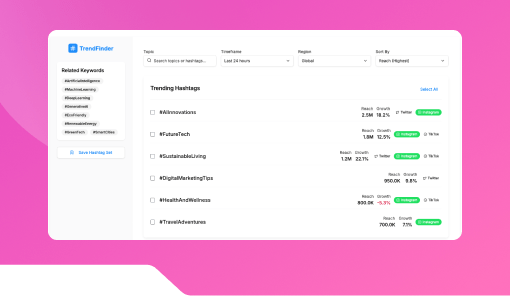
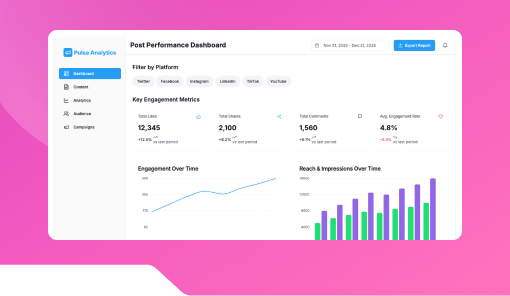
The Audience Engagement Heatmap by Kriatix is an AI-powered visualization tool that shows how audiences interact with your content across platforms. It highlights engagement intensity by time, content type, and channel so teams can focus on what truly captures attention.
🔹 Start Free Trial
🔹 Book a Demo
🔹 Request Pricing
What Is the Audience Engagement Heatmap?
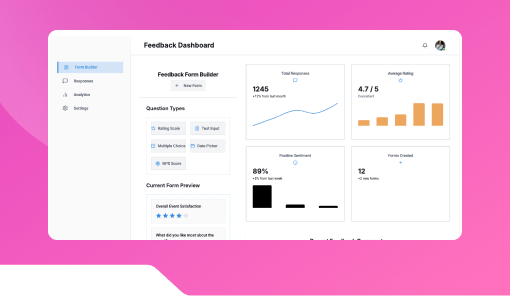
The Audience Engagement Heatmap is a ready-to-use application that converts engagement data into clear visual heatmaps. Instead of scanning rows of metrics, teams instantly see high and low engagement zones, helping them optimize posting times, formats, and messaging.
Who Is It For?
| Role | How They Benefit |
|---|---|
| Social Media Teams | Identify peak engagement times |
| Marketing Teams | Optimize content and campaign timing |
| Brand Managers | Understand audience behavior patterns |
| Agencies | Present visual insights to clients |
| Leadership | Get quick engagement clarity |
Key Features
- Visual heatmap of audience engagement
- Time-based engagement analysis
- Content-type engagement comparison
- Platform-wise engagement views
- High and low engagement zone highlights
- Date range and campaign filters
- Exportable visual reports
Benefits
- Instantly spot engagement patterns
- Optimize posting schedules
- Improve content performance
- Reduce manual data analysis
- Support data-driven content planning
- Make insights easy to share and explain
How It Works
- Connect Engagement Data – Import post or campaign metrics
- Generate Heatmap – System visualizes engagement intensity
- Analyze Patterns – Identify peak and drop-off zones
- Compare Content – Review formats and channels
- Apply Insights – Adjust timing and strategy
Add-ons & Integrations
- Post Performance Dashboard
- Campaign Performance Mapping
- Content Calendar Integration
- Export to Analytics Reports
- Alert Engine for Engagement Drops
Deployment & Access
- Web-based access
- Secure cloud deployment
- Role-based access for teams
- White-label option for agencies and enterprises
What Our Partners Are Saying

"Company AI-powered interfaces have been praised for their usability ,Through exhaustive research and advanced automation, Kriatix made the application fluid, accessible, and future-ready for all users. The team adapted quickly to deliver complex AI-driven tasks and independently developed creative, detailed solutions. Their AI chatbot services stood out in particular — seamlessly integrating conversational AI that enhanced user engagement and streamlined support."
Amit Kumar
Co-Founder, Venture Transform Strategy Consulting LLP

"Kriatix.ai delivered the AI-powered application on time, leveraging Agile methodology to ensure flexibility and efficiency. The team conducted bi-weekly demos, keeping the project transparent and aligned with our goals. Using Jira, GitHub, and Slack, they maintained flawless communication and streamlined project management.Their integration of AI chatbots for real-time feedback loops accelerated our release cycle by nearly 25% and reduced manual validation efforts by 40%, resulting in a smoother, faster, and higher-quality delivery."
Sumit Kumar
CEO, HImalayan Basket Private Limiteds

"The AI-powered website delivered by Kriatix.ai is both visually appealing and high-performing they built a website that not only impressed us with its sleek design but also outperformed our expectations in speed and functionality. Their team worked as true partners—creative, experienced, and highly attentive to every detail.By integrating AI personalization and intelligent chatbots, the website now adapts to user behavior in real time, leading to a 35% increase in engagement and a 25% reduction in support queries."
Sneha Das
CEO, Ittisa
"Kriatix.ai completed the deliverables with excellence, often going the extra mile by suggesting AI-driven alternatives to our change requests. The workflow was seamless, with the team being timely and proactive in addressing every issue. They set realistic expectations, built intelligent automation into our processes, and delivered results with superb quality.Their AI chatbot integration not only streamlined support but also improved responsiveness, ensuring our users always received accurate and instant assistance."
Gururaj Mahale
Director of Growth Marketing, SYNERGOS
Frequently Asked Questions
What engagement metrics are visualized?
Likes, comments, shares, and interaction signals can be mapped.
Can I filter by time and platform?
Yes. Heatmaps can be filtered by date, time, and channel.
Is this useful for campaign analysis?
Absolutely. It helps compare engagement across campaigns.
Can agencies use this for clients?
Yes. Agencies can generate client-specific heatmaps.
Can heatmaps be exported?
Yes. Visual reports can be downloaded and shared.
Ready to Automate Smarter with Kriatix?
Build next-gen, AI-powered apps and workflows—faster, smarter, and tailored to your industry.
Get StartedRelated Products