Monthly Deal Summary Dashboard
Track Revenue Performance & Deal Progress Month by Month
Track monthly deals and revenue


See (Monthly Deal Summary Dashboard) In Action
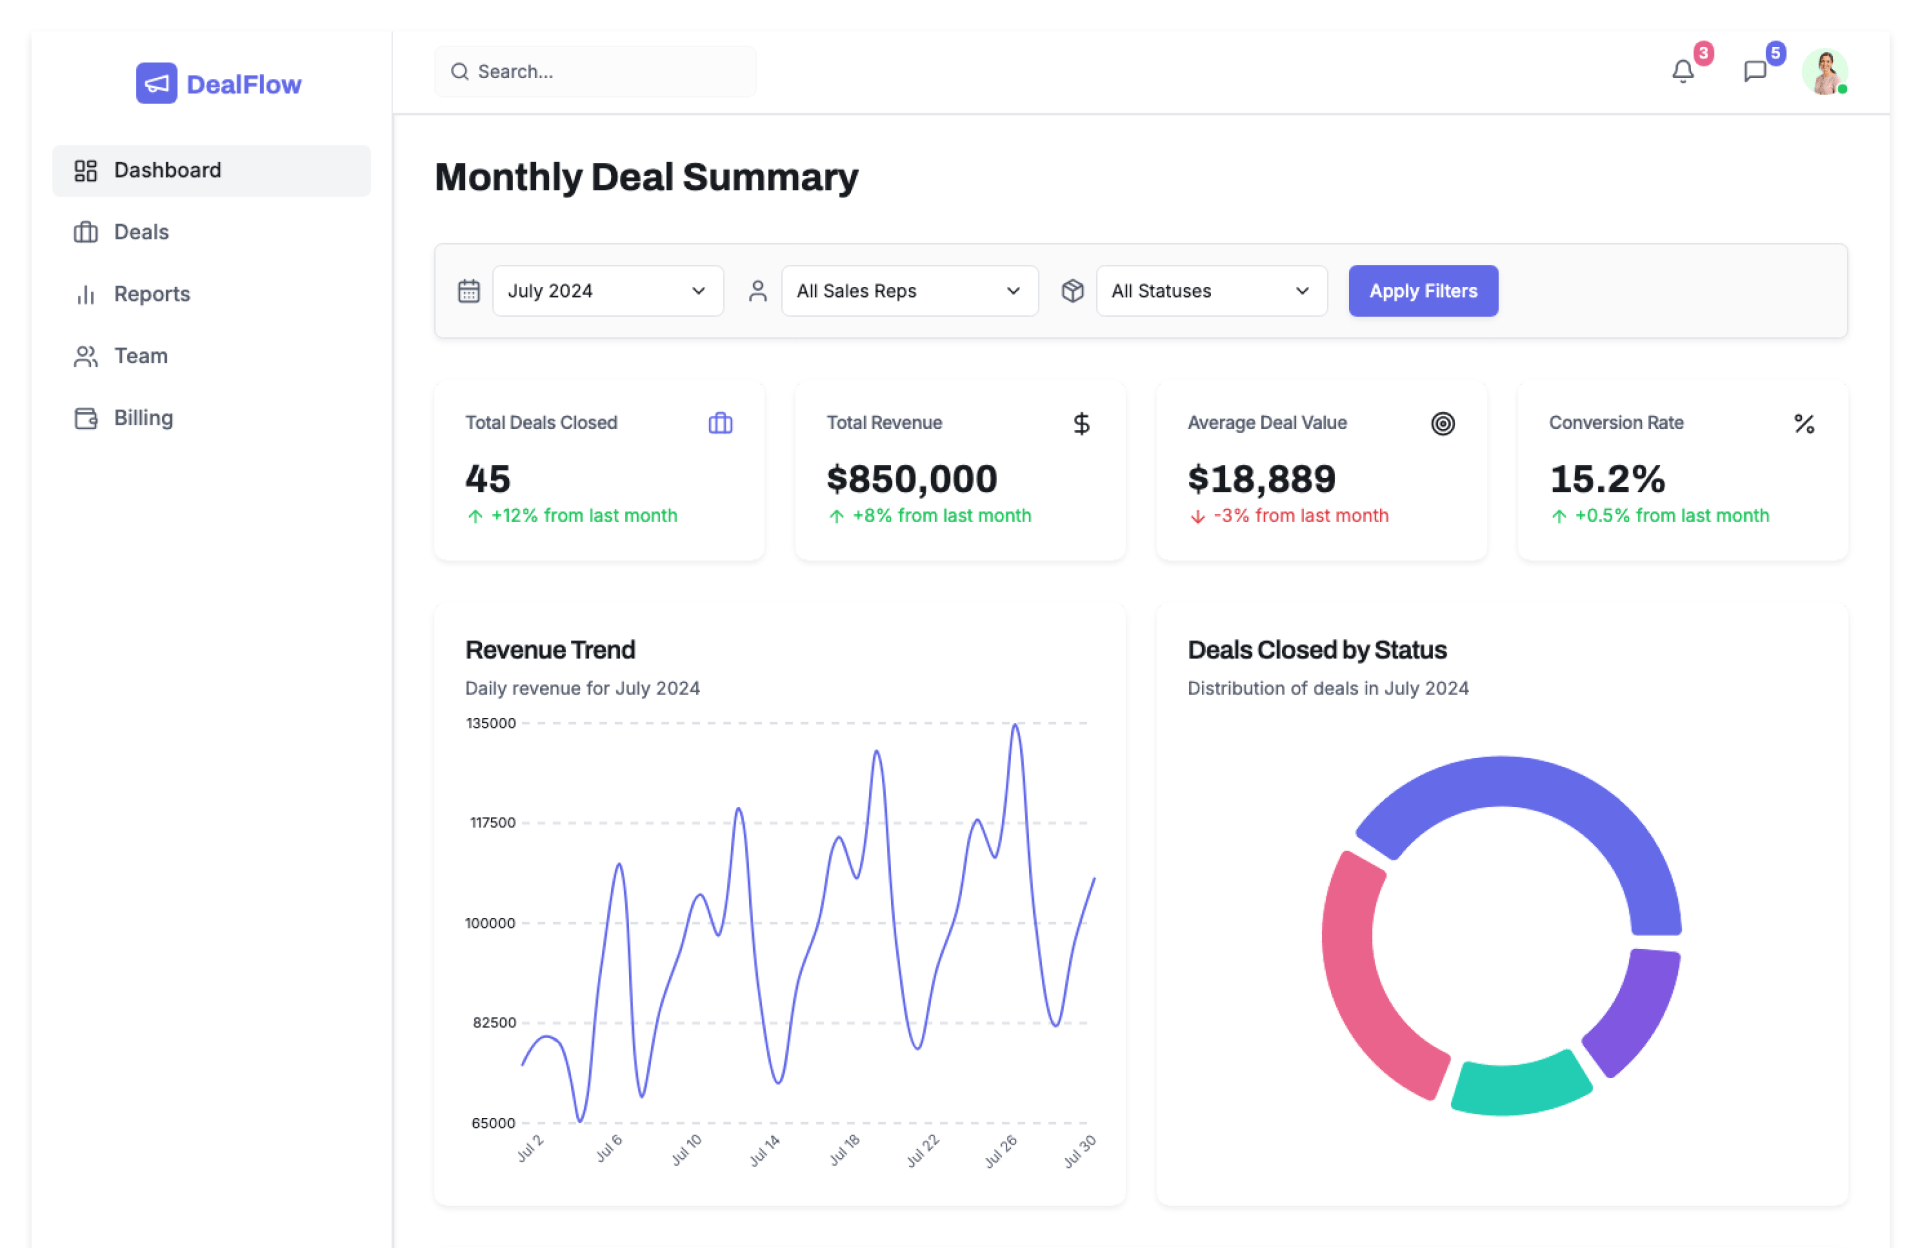
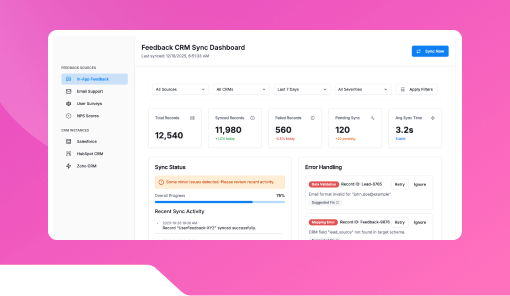
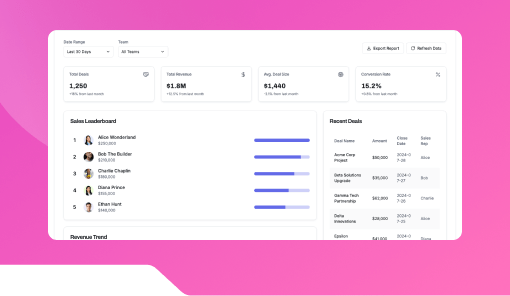
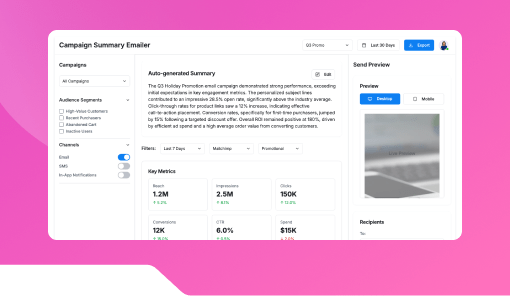
The Monthly Deal Summary Dashboard by Kriatix gives sales leaders and revenue teams a clear, real-time snapshot of deal performance, closures, pipeline movement, and revenue trends—all in one intuitive dashboard. Designed to help businesses forecast accurately and make data-driven decisions, this dashboard turns complex deal data into actionable insights.
🔹 Start Free Trial
🔹 Book a Demo
🔹 Request Pricing
What Is the Monthly Deal Summary Dashboard?
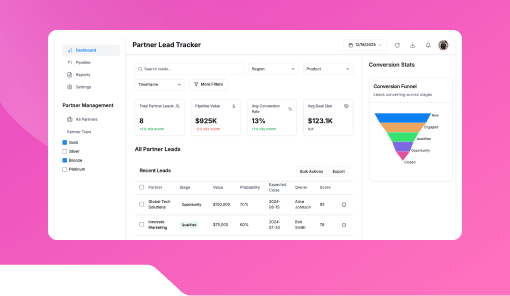
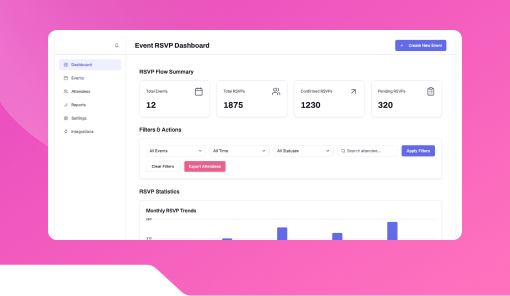
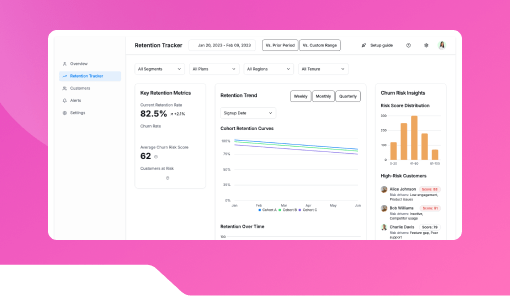
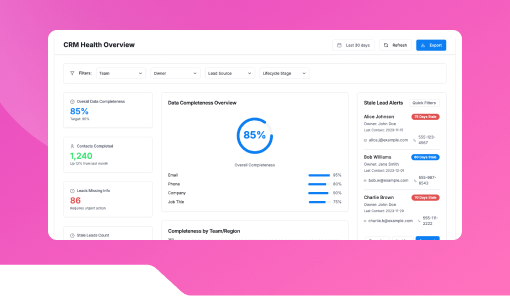
The Monthly Deal Summary Dashboard is a ready-to-use analytics solution that consolidates all deal-related metrics into a single visual view. It enables teams to monitor monthly deal inflow, closed revenue, win/loss ratios, average deal size, and sales performance across teams or regions—without manual reporting.
Who Is It For?
| Role | How They Benefit |
|---|---|
| Sales Managers | Monitor monthly performance and team productivity |
| Revenue Leaders | Forecast revenue and identify growth trends |
| Finance Teams | Align revenue data with financial planning |
| Business Owners | Get a high-level view of deal health and growth |
| Operations Teams | Reduce manual reporting and data inconsistencies |
Key Features
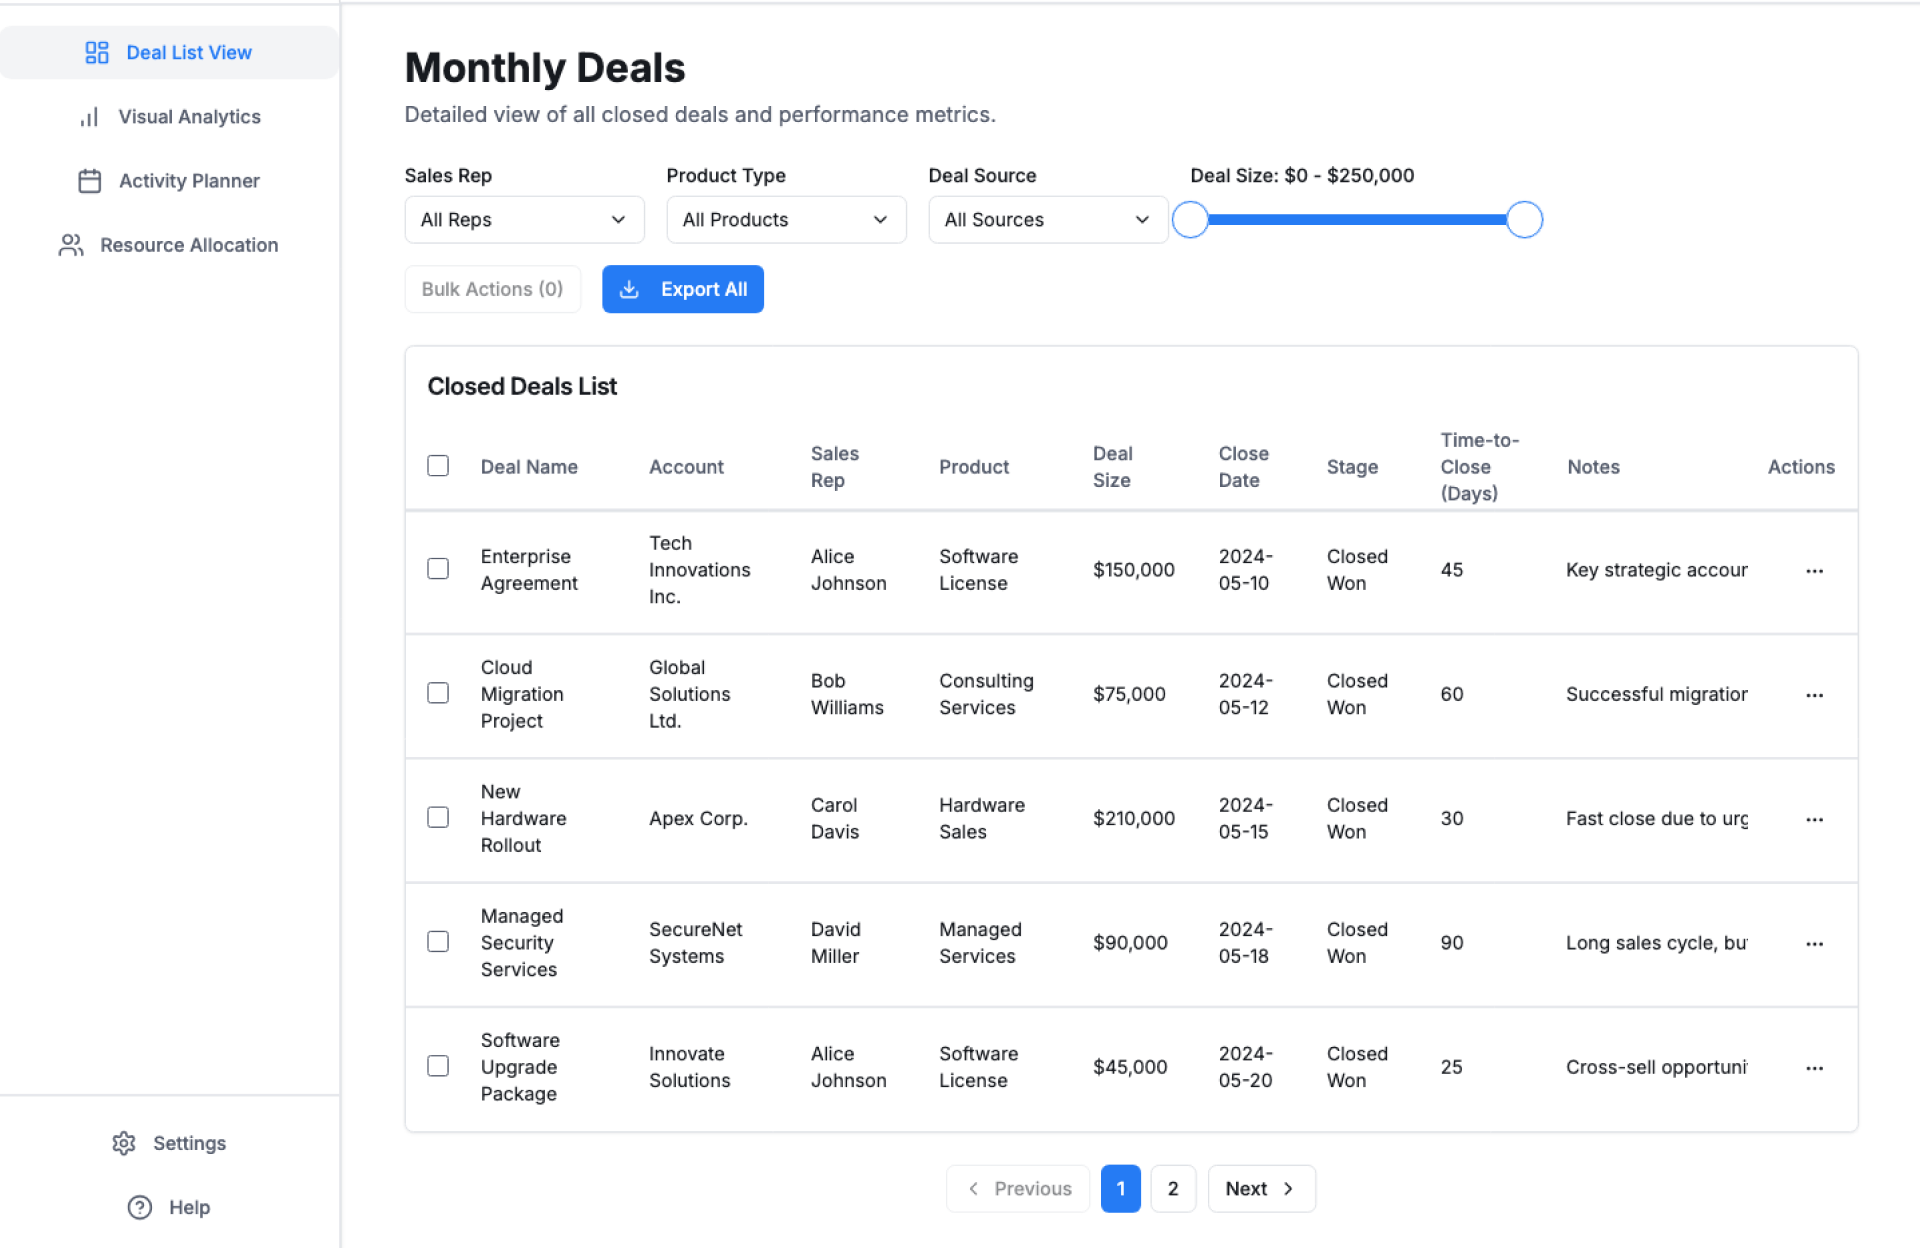
- Monthly deal inflow and closure tracking
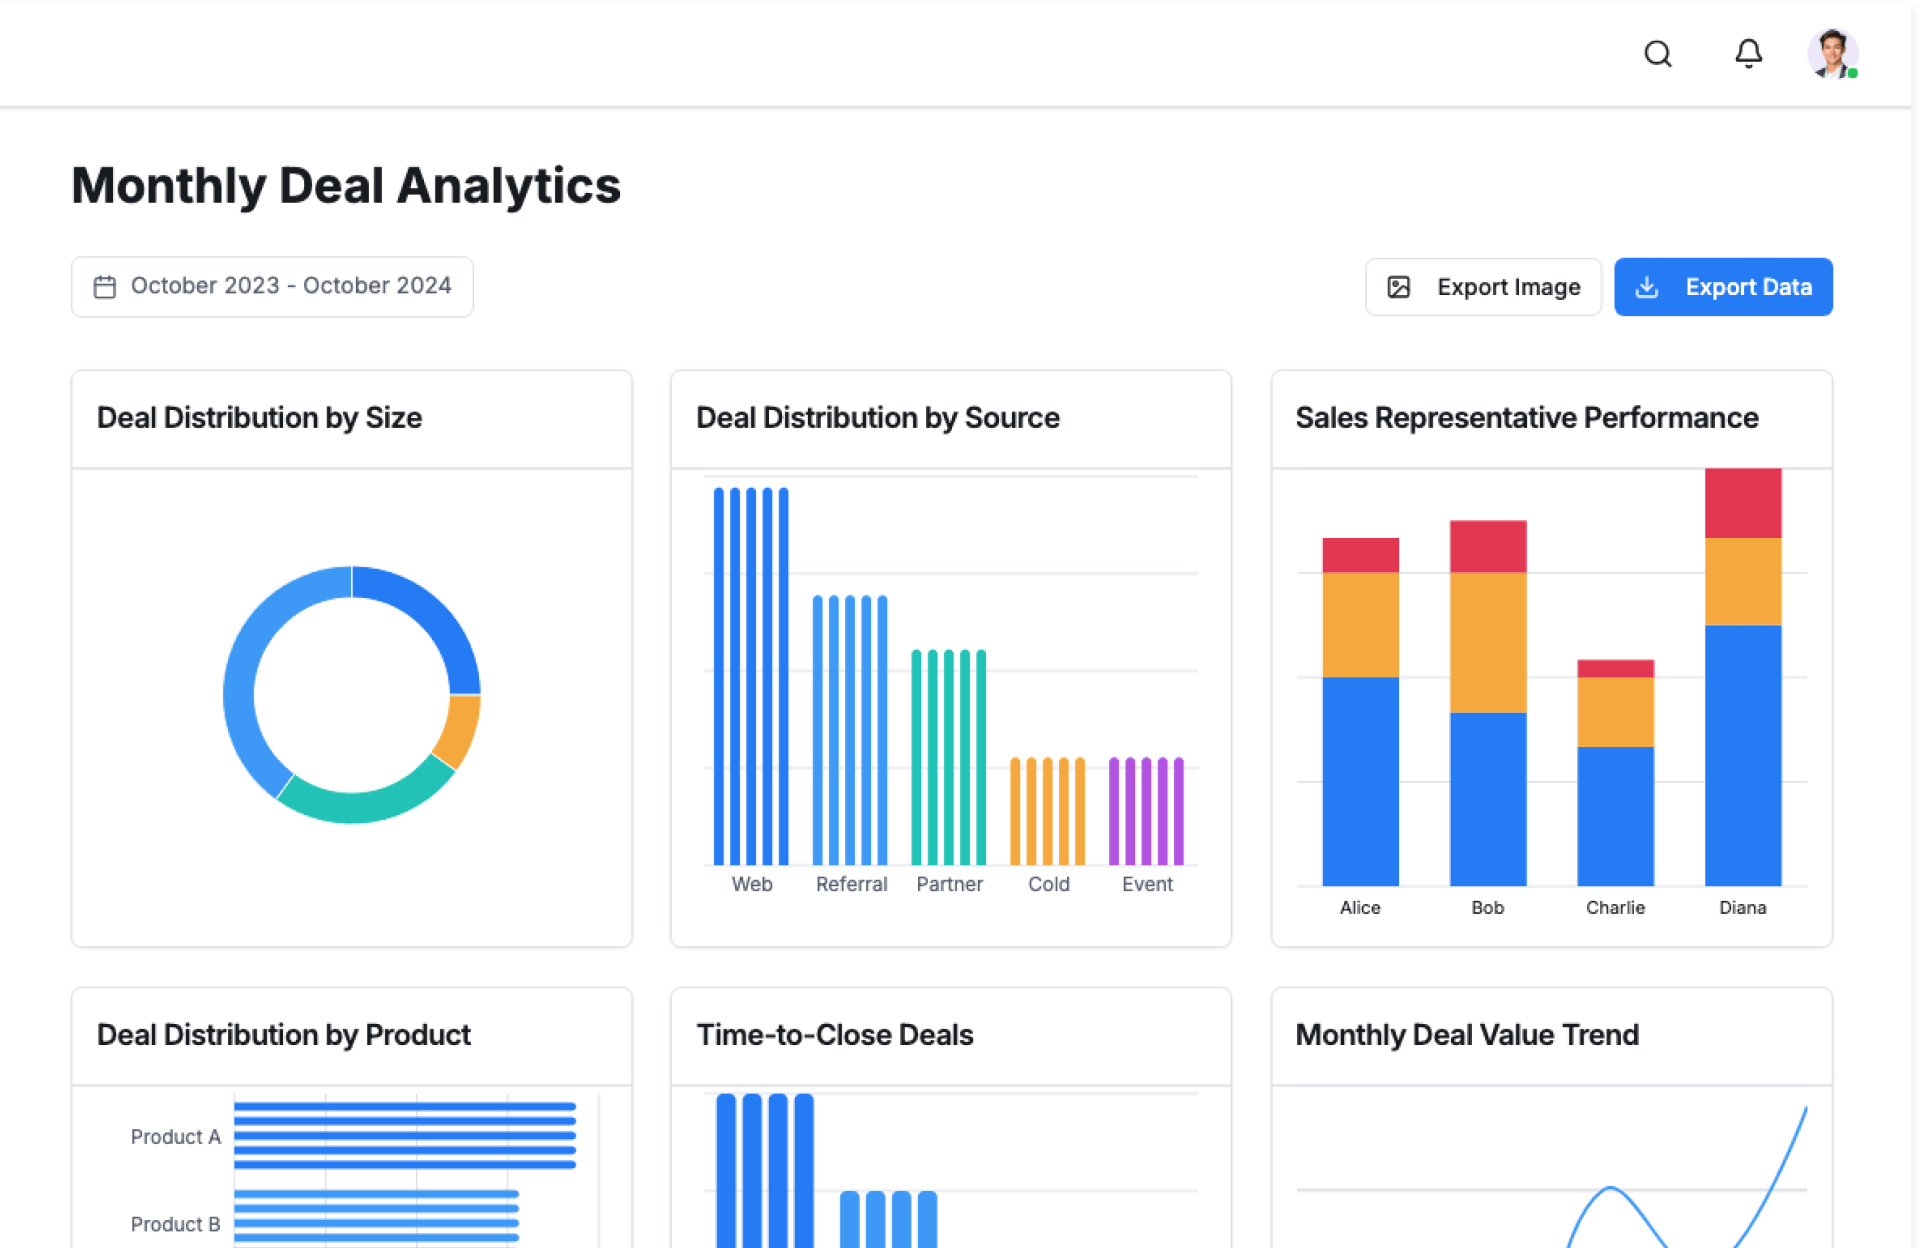
- Revenue, win-rate, and loss analysis
- Pipeline value vs closed revenue comparison
- Sales rep and team-wise performance metrics
- Average deal size and sales cycle insights
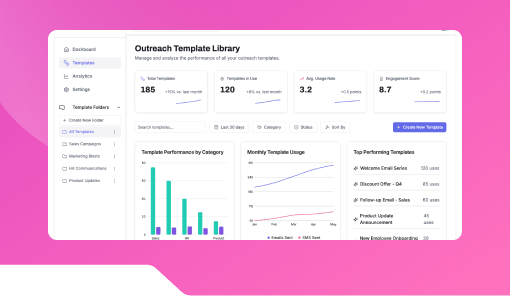
- Interactive charts and drill-down views
- Exportable reports for leadership reviews
Benefits
- Gain instant visibility into monthly deal performance
- Improve forecasting accuracy with real-time data
- Identify bottlenecks in the sales pipeline
- Make faster, data-backed business decisions
- Reduce time spent on manual reporting
- Align sales, finance, and leadership teams
How It Works
- Connect Deal Data – Sync deals from your CRM or sales system
- Define Monthly Metrics – Choose KPIs like revenue, wins, losses
- Visualize Performance – View charts, summaries, and comparisons
- Analyze Trends – Track month-over-month growth or decline
- Share Insights – Export reports or share dashboards with stakeholders
Add-ons & Integrations
- CRM Integration (Salesforce, HubSpot, Zoho)
- Sales Forecasting Module
- Revenue Analytics Dashboard
- Excel & Google Sheets Export
- Slack and Email Reporting Alerts
Deployment & Access
- Web and Tablet optimized dashboards
- Secure cloud-based or on-premise deployment
- Role-based access controls
- Enterprise-ready and fully brandable
What Our Partners Are Saying

"Company AI-powered interfaces have been praised for their usability ,Through exhaustive research and advanced automation, Kriatix made the application fluid, accessible, and future-ready for all users. The team adapted quickly to deliver complex AI-driven tasks and independently developed creative, detailed solutions. Their AI chatbot services stood out in particular — seamlessly integrating conversational AI that enhanced user engagement and streamlined support."
Amit Kumar
Co-Founder, Venture Transform Strategy Consulting LLP

"Kriatix.ai delivered the AI-powered application on time, leveraging Agile methodology to ensure flexibility and efficiency. The team conducted bi-weekly demos, keeping the project transparent and aligned with our goals. Using Jira, GitHub, and Slack, they maintained flawless communication and streamlined project management.Their integration of AI chatbots for real-time feedback loops accelerated our release cycle by nearly 25% and reduced manual validation efforts by 40%, resulting in a smoother, faster, and higher-quality delivery."
Sumit Kumar
CEO, HImalayan Basket Private Limiteds

"The AI-powered website delivered by Kriatix.ai is both visually appealing and high-performing they built a website that not only impressed us with its sleek design but also outperformed our expectations in speed and functionality. Their team worked as true partners—creative, experienced, and highly attentive to every detail.By integrating AI personalization and intelligent chatbots, the website now adapts to user behavior in real time, leading to a 35% increase in engagement and a 25% reduction in support queries."
Sneha Das
CEO, Ittisa
"Kriatix.ai completed the deliverables with excellence, often going the extra mile by suggesting AI-driven alternatives to our change requests. The workflow was seamless, with the team being timely and proactive in addressing every issue. They set realistic expectations, built intelligent automation into our processes, and delivered results with superb quality.Their AI chatbot integration not only streamlined support but also improved responsiveness, ensuring our users always received accurate and instant assistance."
Gururaj Mahale
Director of Growth Marketing, SYNERGOS
Frequently Asked Questions
Can this dashboard connect to my existing CRM?
Yes, it integrates seamlessly with popular CRM platforms to pull deal data automatically.
Does it support month-over-month comparisons?
Absolutely. You can compare performance across months, quarters, or custom periods.
Can I track individual sales rep performance?
Yes, the dashboard provides detailed rep-wise and team-wise insights.
Is the dashboard customizable?
You can customize KPIs, charts, filters, and reporting views to match your business needs.
Can reports be exported for leadership meetings?
Yes, reports can be exported in formats like PDF or Excel for easy sharing.
Ready to Automate Smarter with Kriatix?
Build next-gen, AI-powered apps and workflows—faster, smarter, and tailored to your industry.
Get StartedRelated Products